(I'm trying to get a post out every week, as a challenge to produce something intellectual outside of work. Some* of this is recycled from Twitter, as I tend to send things there first.)
Multicriteria decision-making gets a boost from Covid-19
A potential upside (among many downsides) of the coronavirus covid-19 event is that some smart people will realize that there's more to life choices than a balance between efficiency and convenience and will build [for themselves if not the system] some resilience.
In a very real sense, it's possible that PG&E's big fire last year and follow-up blackouts saved a lot of people the worst of the new flu season: after last Fall, many local non-preppers stocked up on N95 masks and home essentials because of what chaos PG&E had wrought in Northern California.
Anecdotal evidence is a bad source for estimates: coin flips
Having some fun looking at small-numbers effects on estimates or how unreliable anecdotal evidence really can be as a source of estimates.
The following is a likelihood ratio of various candidate estimates versus the maximum likelihood estimate for the probability of heads given a number of throws and heads of a balanced coin; because there's an odd number of flips, even the most balanced outcome is not 50-50:
This is an extreme example of small numbers, but it captures the problem of using small samples, or in the limit, anecdotes, to try to estimate quantities. There's just not enough information in the data.
This is the numerical version of the old medicine research paper joke: "one-third of the sample showed marked improvement; one-third of the sample showed no change; and the third rat died."
Increasing sample size makes for better information, but can also exacerbate the effect of a few errors:
Note that the number of errors necessary to get the "wrong" estimate goes up: 1 (+1/2), 3, 6.
Context! Numbers need to be in context!
I'm looking at this pic and asking myself: what is the unconditional death rate for each of these categories; i.e. if you're 80 today in China, how likely is it you don't reach march 15, 2021, by all causes?
Because that'd be relevant context, I think.
Estimates vs decisions: why some smart people did the wrong thing regarding Covid-19
On a side note, while some people choose to lock themselves at home for social distancing, I prefer to find places outdoors where there's no one else. For example: a hike on the Eastern span of the Bay Bridge, where I was the only person on the 3.5 km length of the bridge (the only person on the pedestrian/bike path, that is).
How "Busted!" videos corrupt formerly-good YouTube channels
Recently saw a "Busted!" video from someone I used to respect and another based on it from someone I didn't; I feel stupider for having watched the videos, even though I did it to check on a theory. (Both channels complain about demonetization repeatedly.) The theory:
Many of these "Busted!" videos betray a lack of understanding (or fake a lack of understanding for video-making reasons) of how the new product/new technology development process goes; they look at lab rigs or technology demonstrations and point out shortcomings of these rigs as end products. For illustration, here's a common problem (the opposite problem) with media portrayal of these innovations:
It's not difficult to "Bust!" media nonsense, but what these "Busted!" videos do is ascribe the media nonsense to the product/technology designers or researchers, to generate views, comments, and Patreon donations. This is somewhere between ignorance/laziness and outright dishonesty.
In the name of "loving science," no less!
Johns Hopkins visualization makes pandemic look worse than it is
Not to go all Edward Tufte on Johns Hopkins, but the size of the bubbles on this site makes the epidemic look much worse than it is: Spain, France, and Germany are completely covered by bubbles, while their cases are
0.0167 % for Spain 0.0070 % for Germany 0.0067 % for France
At some point someone should explain to journalists that cumulative deaths always go up, it's part of the definition of the word "cumulative." Then again, maybe it's too quantitative for some people who think all numbers ending in "illions" are the same scale.
Stanford Graduate School of Education ad perpetuates stereotypes about schools of education
If this is real, then someone at Stanford needs to put their ad agency "in review." (Ad world-speak for "fired with prejudice.")
This is a general comment on how new technologies are presented in the media: usually something that is either a laboratory test rig or at best a proof-of-concept technology demonstration is hailed as a revolutionary product ready to take the world and be deployed at scale.
Consider how many is "a lot of," as a function of success probabilities at each stage:
Yep, notwithstanding all good intentions in the world, there's a lot of work to be done behind the scenes before a test rig becomes a product at scale, and many of the candidates are eliminated along the way.
Recreational math: statistics of the maximum draw of N random variables
At the end of a day of mathematical coding, and since Rstudio was already open (it almost always is), I decided to check whether running 1000 iterations versus 10000 iterations of simulated maxima (drawing N samples from a standard distribution and computing the maximum, repeated either 1000 times or 10000 times) makes a difference. (Yes, an elaboration on the third part of this blog post.)
Turns out, not a lot of difference:
Workflow: BBEdit (IMNSHO the best editor for coding) --> RStudio --> Numbers (for pretty tables) --> Keynote (for layout); yes, I'm sure there's an R package that does layouts, but this workflow is WYSIWYG.
The R code is basically two nested for-loops, the built-in functions max and rnorm doing all the heavy lifting.
Added later: since I already had the program parameterized, I decided to run a 100,000 iteration simulation to see what happens. Turns out, almost nothing worth noting:
Adding a couple of extra lines of code, we can iterate over the number of iterations, so for now here's a summary of the preliminary results (to be continued later, possibly):
And a couple of even longer simulations (all for the maximum of 10,000 draws):
Just for fun, the probability (theoretical) of the maximum for a variety of $N$ (powers of ten in this example) is greater than some given $x$ is:
More fun with Solar Roadways
Via EEVblog on twitter, the gift that keeps on giving:
This Solar Roadways installation is in Sandpoint, ID (48°N). Solar Roadways claims its panels can be used to clear the roads by melting the snow… so let's do a little recreational numerical thermodynamics, like one does.
Average solar radiation level for Idaho in November: 3.48 kWh per m$^2$ per day or 145 W/m$^2$ average power. (This is solar radiation, not electrical output. But we'll assume that Solar Roadways has perfectly efficient solar panels, for now.)
Density of fallen snow (lowest estimate, much lower than fresh powder): 50 kg/m$^3$ via the University of British Columbia.
Energy needed to melt 1 cm of snowfall (per m$^2$): 50 [kg/m^3] $\times$ 0.01 [m/cm] $\times$ 334 [kJ/kg] (enthalpy of fusion for water) = 167 kJ/m$^2$ ignoring the energy necessary to raise the temperature, as it's usually much lower than the enthalpy of fusion (at 1 atmosphere and 0°C, the enthalpy of fusion of water is equal to the energy needed to raise the temperature of the resulting liquid water to approximately 80°C).
So, with perfect solar panels and perfect heating elements, in fact with no energy loss anywhere whatsoever, Solar Roadways could deal with a snowfall of 3.1 cm per hour (= 145 $\times$ 3600 / 167,000) as long as the panel and surroundings (and snow) were at 0°C.
Just multiply that 3.1 cm/hr by the efficiency coefficient to get more realistic estimates. Remember that the snow, the panels, and the surroundings have to be at 0°C for these numbers to work. Colder doesn't just make it harder; small changes can make it impossible (because the energy doesn't go into the snow, goes into the surrounding area).
Another week, another Rotten Tomatoes vignette
This time for the movie Midway (the 2019 movie, not the 1972 classic Midway):
Critics and audience are 411,408,053,038,500,000 (411 quadrillion) times more likely to use opposite criteria than same criteria.
Recap of model: each individual has a probability $\theta_i$ of liking the movie/show; we simplify by having only two possible cases, critics and audience using the same $\theta_0$ or critics using a $\theta_1$ and audience using a $\theta_A = 1-\theta_1$. We estimate both cases using the four numbers above (percentages and number of critics and audience members), then compute a likelihood ratio of the probability of those ratings under $\theta_0$ and $\theta_1$. That's where the 411 quadrillion times comes from: the probability of a model using $\theta_1$ generating those four numbers is 411 quadrillion times the probability of a model using $\theta_0$ generating those four numbers. (Numerical note: for accuracy, the computations are made in log-space.)
Google gets fined and YouTubers get new rules
Via EEVBlog's EEVblab #67, we learn that due to non-compliance with COPPA, YouTube got fined 170 million dollars and had to change some rules for content (having to do with children-targeted videos):
Backgrounder from The Verge here; or directly from the FTC: "Google and YouTube Will Pay Record $170 Million for Alleged Violations of Children’s Privacy Law." (Yes, technically it's Alphabet now, but like Boaty McBoatface, the name everyone knows is Google. Even the FTC uses it.)
According to Statista: "In the most recently reported fiscal year, Google's revenue amounted to 136.22 billion US dollars. Google's revenue is largely made up by advertising revenue, which amounted to 116 billion US dollars in 2018."
170 MM / 136,220 MM = 0.125 %
2018 had 31,536,000 seconds, so that 170 MM corresponds to 10 hours, 57 minutes of revenue for Google.
Engineering, the key to success in sporting activities
Bowling 2.0 (some might call it cheating, I call it winning via superior technology) via Mark Rober:
I'd like a tool wall like his but it doesn't go with minimalism.
No numbers: recommendation success but product design fail.
Nerdy, pro-engineering products are a good choice for Amazon to recommend to me, but unfortunately many of them suffer from a visual form of "The Igon Value Problem."
Science illustrations made by people without quantitative sensibility
From a tweet I saw retweeted by someone I follow (lost the reference), this is supposed to be a depiction of the Chicxulub impact:
My first impression (soon confirmed by minor geometry) was that that impact was too big; yes, the meteor was big for a meteor (ask the dinosaurs…), but the Earth is really really big compared to meteors. Something that created such a large explosion on impact wouldn't just kill 75% of the species on Earth, it would probably kill everything on the planet down to the last replicating protein structure, boil the oceans, and poison the atmosphere for millions of years.
Think Vorlon planet-killer, not Centauri mass driver. 🤓
Using a graphical estimation method (fit a circle over that segment of the Earth to get the radius in pixels, so that we can translate pixels into kilometers), we can see that this is an overestimation of at least 6-fold in linear dimensions (the actual crater diameter is ~150km):
6-fold increase in linear dimensions implies 216-fold increase in volume (and therefore mass); using the estimated energy of the actual impact from the Wikipedia, the energy of the impact above would be between $2.81 \times 10^{26}$ and $1.25 \times 10^{28}$ J or up to around 22 billion times the explosive power of the largest H-bomb ever detonated, the Tsar Bomba.
The area of the Earth is 510.1 million square kilometers, so that's 43 Tsar Bombas per square kilometer --- which is a lot, considering that the one Tsar Bomba that was detonated had a complete destruction radius in excess of 60 km (or an area of 11,310 square kilometers) and partial destruction (of weaker structures) at distances beyond 100 km (or an area of 31,416 square kilometers). And, again, that's 43 of those per square kilometer; so, yeah, that would probably have been the end of all life as we know it on Earth, and I wouldn't be here blogging about it.
A more accurate measurement, using a bit of trigonometry (though still using Eye 1.0 for the tangents):
Because of the eye-based estimation, it's a good idea to do some sensitivity analysis:
(Results are slightly different for the measured case because of full-precision calculation as opposed to dropped digits in the original, hand-calculator and sticky notes-based calculation.)
It gets worse. In some depictions we see the meteor, and it's rendered at the size of a planetoid (using the graphical method here too, because it's quick and accurate enough):
To be clear on the scale, that image is 442 pixels wide, the actual Chicxulub meteor at the same scale as the Earth would be 1-7 pixels wide, which is smaller than the dots in the dotted lines.
For additional context, the diameter of the Moon is 3,474 km, so the meteor in the image above is almost 1/3 the diameter of the Moon (28% to be more accurate) and that impact crater is over 1/2 the diameter of the Moon (60% to be more accurate).
Solar energy density in context
2 square kilometers for 100 MW nameplate capacity… and they're in the shade in that photo, so not producing anything at the moment.
Capacity factor for solar is [for obvious reasons] hard bound at 50%. For California, our solar CF is 26%; let's give Peter Mayle's Provence slightly better CF at 30%, and those 2 square km of non-dispatchable capacity become about 1/20 of a single Siemens SGT-9000H (fits in 1200 square meters with a lot of space to spare for admin offices and break room, works 24/7).
Nano-review of R Programming Compiler for the iPad
Basics: Available on the iOS app store; uses a remote server to run the code, so must have a net connection. Free for the baseline but seven dollars for plots and to use packages, which I paid. The extended keyboard is very helpful considering the limitations of the iPad keyboard. (Also runs on the iPhone and the iPod touch, though I haven't used it on them yet.)
I wouldn't use it to develop code or even to run serious models, but if there's a need to do a quick simulation or analysis (or even as a matrix calculator), it's better than Numbers. Can also be used offline to browse (and edit) code, though not to run it.
The programmer-joke code snippet in the above screen capture run instantly over a free lobby internet in a hotel conference center, so the service is pretty efficient for these small tasks, which are the things I'd be using this for.
Some retailers plan to eat the losses from tariffs
My comment (on twitter): Yeah, these are well-behaved cost and demand functions so when a tariff is added to the cost, typically the quantity drops and the price rises, unless there's some specific strategic reason to incur short-term opportunity costs.
Rationale (from any Econ 101 course, but I felt like drawing my own, just for fun):
Note that Bain's breakpoint at 50% of the tariff is the solution to the problem under linear demand with constant marginal cost, but other shapes of demand can make that number much bigger, for example, this exponential leads to 74% (numbers rounded in the diagram but not in the computation):
The demand function is nothing awkward or surprising, just a nice decreasing exponential:
On the other hand, if the marginal cost decreases with quantity, particularly if marginal cost is strongly convex, there's a chance the actual price increase from a tariff is higher than the tariff, even with linear demand:
Note that this is different from lazy markup pricing. Lazy markup pricing always raises the price by more than the tariff, so in places where such outdated pricing practices [cough Portugal /cough] are common, tariffs have a disproportionate negative impact on the economy and general welfare.
Late non-numerical entry: Another news item based on not understanding the life cycle of technologies
From Bloomberg (among many others) we learn that there's a new solar energy accumulator technology, and as usual the news write it up as if product deployment at scale is right around the corner, whereas what we have here is a lab testing rig… that's a lot of steps before there's a product at scale. And many of those steps are covered with oubliettes.
Congratulations to the team improving battery technology. But:
I. According to the news, this is a technology demonstration, though that might be inaccurate (the original report makes it a testing rig, which is one step farther back from a final product). There's a lot of work to do (and many avenues for failure) before this becomes a deployable product, much less at scale.
II. Charging a 75 kWh battery (AFAIK, the smallest battery in a Tesla car) in 10 minutes requires a charging power of 450 kW. Even using 480 V as the charging voltage, that's still a 937.5 A current; those cables will need some serious heft, and any impurities in the contacts will be a serious fire hazard.
III. A typical gas pump moves about 3 l of gasoline per second. Gasoline has around 34 MJ/l energy density, so that pump has a power rating of 102 MW, 227 times higher energy throughput than the new battery. Even if the distance/energy efficiency of internal combustion engines is lower than electric motors, that's a big difference. Also, you can buy Reese's peanut butter cups at gas stations.
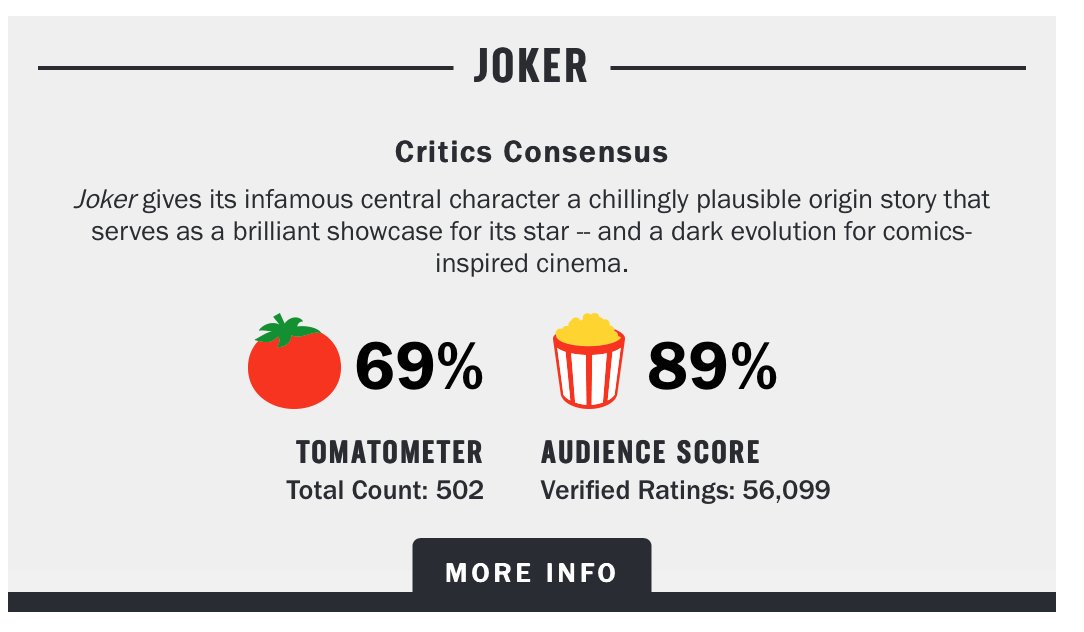
More fun with Rotten Tomatoes
Watchmen (HBO series) shows that sometimes when data changes, the conclusions change.
Despite the caterwauling of many in the comic-book nerd community (not that I would know, as I don't belong… okay, I occasionally might take a look, but I'm not a comic book nerd… not since the early 70s…), data show that it's much more likely that the critics and the audience are using similar criteria for their evaluation of Joker than opposite criteria.
How much more likely? Glad you asked:
210,565,169,600,721,000,000,000,000,000,000,000,000,000,000,000,000,000,000,000,000,000,000,000,000,000,000,000,000,000,000,000,000,000,000,000,000,000,000,000,000,000,000,000,000,000,000,000,000,000,000,000,000,000,000,000,000 times more likely.
Ah, the power of parameterized models: you set them once, you can nerd out on them till the end of time. (I haven't watched either the show or the movie. Maybe when they get to Netflix or Amazon Prime.)
Added Nov 3: Haven't watched it yet, but Rotten Tomatoes data shows that critics are 1,361,188 times more likely to be using the same criteria as the audience than opposite criteria to evaluate "For All Mankind."
Some progress in nuclear fusion?
Some simple physics:
1 kg mass = 9E16 J of energy ($E = mc^2$)
Coal has 30 MJ/kg specific energy
10E6 kg coal have 3E14 J (assuming Bloomberg meant using combustion)
Fusion is to have 1/300 efficiency relative to pure mass-energy conversion?
Kudos. Now, get to it!
Shredded Sports Science eats an apple
Shredded Sports Science has a video making fun of people who know even less about fitness and nutrition than the "experts" in those "sciences," where he takes a bite of an apple and says "one rep," another bite, "two reps," the joke being on Chris Heria of Thenx.
Huh, the quant says, I wonder how the numbers will go…
Let's say a warm-up set of 100 kg squats and the total vertical path is 1 m. How much energy does one rep use, just for the mechanical work?
Naïve physics neophyte: huh, zero, the rep starts and ends at the same point.
No. The mechanics of the rep are different on the way down and on the way up: assuming that the weight moves at constant speed most of the time, the down movement requires the body provide work to counteract acceleration, so we can approximate the total work by 2 * 100 * 9.8 * 1 = 1960 J.
Note that this is just the mechanical part. Muscles have less than 100% efficiency and that efficiency changes as fatigue increases, hence the heat (heat, and to a smaller degree, changes to the mix of waste products of muscle contraction, represent losses in efficiency).
The other side of the coin is the chemical energy in that apple, which is measured by the magic ['delusion' or 'deception' also work here] of mistaking the simple process of combustion for the very complex processes of digestion and respiration. But let's pretend…
Apples are basically 1/3 sugar and 2/3 water, with some esters and ester aldehydes for taste and aroma, so for a small bite let's say 15g of apple we get 5 g of sugar; that's 20 kCal or ~ 84,000 J.
Shredded Sport Science's little joke would point to a combined digestion, respiration, and muscle contraction efficiency of 2.33%.
Evolution would have selected this biochemical parameterization right out of the gene pool.
Fun with energy
Talk about counting calories in a way that matters. (From the BP energy stats 2019; and yes, their tables are in MtOE, not calories, but unit changes are trivial, except maybe for gymbros.)
Bay Area versus Europe
With the return of Silicon Valley on HBO, there's a lot of hating on the Bay Area going around, so here's a thought in numbers…
There's a lot of management and technology writing that refers to "exponential growth," but I think that most of it is a confusion between early life cycle convexity and true exponentials.
Here's a bunch of data points from what looks like exponential growth:
Looks nicely convex, and that red curve is an actual exponential fit to the data,
\[
y = 0.0057 \, \exp(0.0977 \, x) \qquad [R^2 = 0.971].
\]
Model explains 97.1% of variance. I mean, what more proof could one want? A board of directors filled with political apparatchiks? A book by [a ghostwriter for] a well-known management speaker? Fourteen years of negative earnings and a CEO that consumes recreational drugs during interviews?
Alas, those data points aren't proof of an exponential process, rather, they are the output of a logistic process with some minor stochastic disturbances thrown in:
\[
y = \frac{1}{1+\exp(-0.1 \, x+5)} + \epsilon_x \qquad \epsilon_x \sim \text{Normal}(0,0.005).
\]
The logistic process is a convenient way to capture growth behavior where there's a limited potential: early on, the limit isn't very important, so the growth appears to be exponential, but later on there's less and less opportunity for growth so the process converges to the potential. This can be seen by plotting the two together:
This difference is important because — and this has been a constant in the management and technology popular press — in the beginning of new industries, new segments in an industry, and new technologies, unit sales look like the data above: growth, growth, growth. So, the same people who declared the previous ten to twenty s-shaped curves "exponential economies" at their start come out of the woodwork once again to tell us how [insert technology name here] is going to revolutionize everything.
Ironically, knowledge is one of the few things that shows a rate of growth that's proportional to the size of the [knowledge] base. Which would make knowing stuff (like the difference between the convex part of an s-shaped curve and an exponential) a true exponential capability.
But that would require those who talk of "exponential economy" to understand what exponential means.
Production note: Some credit to Thunderf00t, for had he not made such a complete pig's breakfast of his analysis of Hyperloop, this "why scientists are bad at engineering" post wouldn't have been written. *
There are significant differences between an idea ("it would be great to fly from London to New York in four hours, let's use fighter jet technologies to make an airliner") and a marketable product (the Concorde). That's just on the engineering side, without the additional complexity of the business side.
Ideas to technology
An idea is just an organization of thoughts, for example: "if we got a train riding on magnets instead of wheels, we could get rid of friction, wear, and fatigue; then if we put the train in a low pressure tube we could go really fast."
This idea becomes a technology when you get something actually working; this something is called, for obvious reasons, a technology demonstrator. It's used to show that the technology has some potential, and it used to be a minimum requirement for getting funding. (More on that below.)
Linear motor Maglev technology is already available, though maybe not quite up-to-spec, but there are some technological barriers to overcome regarding the tubes and the pods.
Here it's worth noting a common error of reasoning, which is to assume that just because something hasn't been done, it can't be done.
For example, TF's use of a video excerpt showing Brian Cox inside "the largest vacuum chamber in existence." It's the largest because there was never a need for a larger one. It doesn't represent a technology limit. It's not that difficult to make a long tube that can take a big pressure differential (= pipeline), though we currently design this kind of tube for over-pressure because that's what its currentuse requires.
Many of the "the largest X in existence" limits are determined by economic necessity, not laws of physics. Think about the largest pizza ever made; was its size determined by some limit of the laws of physics?
Sometimes the technology is based on existing science, or co-developed with it, like some of the current work in biotech. Sometimes the technology precedes the science needed to explain it (or at least the attention of the scientists whose expertise is necessary to build the explanation), as was the case of most of the mechanical innovations in the first industrial revolution.
Part of the funding of Hyperloop is an investment in technology development that will have applications beyond the Hyperloop itself ("spillovers"). There's this thingamabob called a "laser" that was imagined as a pew-pew death-ray in sciFi, became reality as a pure Physics experiment, and mostly is used to checkout groceries, read data off of polycarbonate discs, pump bits down fiberoptics, and annoy cats. Oh, some pew-pew, too.
Sometimes licensing or developing the technology in directions other than the originally intended ends up being the most important part of the business.
It's probably worth noting two things at this point:
Hyperloop projects haven't finished the technology development phase; that would be indicated by a technology demonstration. Assertions about the final product at this stage are futile.
Getting funded by professional investment organizations (with their due diligence and fiduciary obligations) requires passing much stricter scrutiny than that given to crowdsourced projects (like Solar Roadways, the Fontus water bottle, or Triton artificial gills).
Technology to prototype
Once the technologies necessary for implementing the idea exist, they have to be put together and made to work under laboratory conditions or at test-scale, in the form of prototypes.
Here's where the "scientists are bad at engineering" point becomes most pointy.
Prototypes will obey the laws of Physics (and other sciences), since they operate in reality. It may be the case that the laws aren't known yet (as with the first industrial revolution) or that they are being simultaneously developed, but no prototype can violate the laws of Physics.
The problem is that there's a lot of specialized knowledge that goes into engineering. Each small piece of knowledge obeys the laws of Physics, but deriving them from first principles isn't practical. (And real scientists don't dirty their hands with engineering.)
For example, a physicist friend of mine didn't know why the suspenders of a suspension bridge (the vertical cables from the big catenary cable to the bridge deck) sometimes have a thin metal helix around them. When pressed on it he said "it's probably a reinforcement of some kind." I knew that the helix is there to limit aerodynamic flutter, and told him. He said, "oh, of course" and mentioned some interesting facts of turbulent flow.
That's what I mean by "science is the foundation of engineering, but scientists don't learn the body of knowledge of engineering." Most scientists are humble enough to understand that there are things they don't know. My physicist friend didn't assert that the helix was for reinforcement; he actually said, "I don't know," a sentence more people would be wise to use.
For illustration, here's a series of videos about metal shop work (the presenter is a professor, I believe, since he keeps talking about research prototypes, but he's seriously shop-savvy):
Instructive and entertaining videos. A big hat tip to Star Simpson for the link, via Casey Handmer. Such is the serendipitous nature of internet knowledge discovery.
A prototype is a one-off, possibly scaled-down, version of the product reduced to its core elements. It's designed to be operated by specialists under controlled circumstances. It requires constant attention during performance and, conversely, is usually over-instrumented for its final purpose (as a product, that is), since part of its purpose as a prototype is to see which parts of the engineering body of knowledge need to be applied to the technology itself.
Sometimes that extensive instrumenting of prototypes helps discover hitherto unknown issues or phenomena and leads to rethinking of extant technologies and redesign or retrofit of existing products. Historically a good part of the body of knowledge of engineering has evolved by this process.
For example, vortex shedding in aircraft wings was not identified for the first several decades of aviation, even though the physics necessary for it was developed in the late 19th Century. Once the engineering idea of vortex shedding wingtips (or, for older airframes being retrofitted, winglets) entered the body of knowledge, it became universal for new airframe design.
The gulf between a prototype, typically a one-off object made to laboratory-grade specifications that requires an expert to operate, and a final product is almost as big as that between idea and prototype, and a lot of other specialized skills are necessary to bridge that gulf.
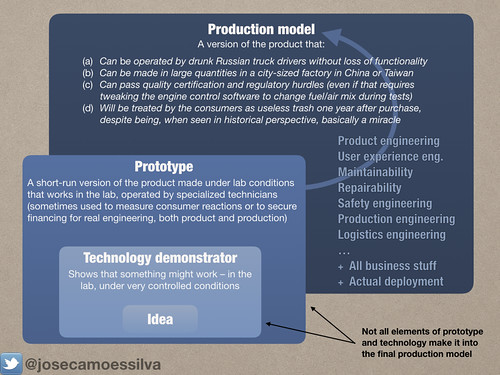
Prototype to product
Any engineering product development textbook will identify a lot of things that separate a prototype from a product, but here are a few off the top of my head (and the figure above):
Products have to be mass-produced by production facilities, not prototyping shops or laboratories. Figuring out how to mass-produce a product and organizing that production is what's called production engineering. Sometimes that involves the development of specialized production technology, and its prototyping and production, which might involve production engineering of its own, which might require... etc.
Products are to be operated by normal people, not expert operators (the drunk Russian truck drivers in the figure were motivated by the Only In Russia twitter account, a terrible sink of productivity). Though it's not entirely accurate, many people believe that Apple's success stems from its ability to deploy technology into final products by making it accessible to average users. That is the field of user experience design.
Products also need to be much more resilient, safe, repairable, and maintainable than prototypes. Though, sadly for the practice of engineering ---and the environment --- the "discard don't repair" mentality has taken hold, so maintainability and repairability aren't priorities in much product design. It being a railway, Hyperloop would have to be designed for both, of course.
There are a lot more. Engineering textbooks exist for a reason, they're not just collections of photos of pretty machines. A lot of knowlege goes into actually making things.
In the case of Hyperloop the product is passenger rail transportation, so there's yet another body of knowledge involved, that of managing railroad operations.
The whole "how hyperloop will kill you" schtick is nonsensical, since there's no final design to evaluate; but it becomes hilarious when almost all the ways to "kill" the passengers have well-established railroad solutions, namely sectioning (you can isolate sections of a line, and you can have isolation joints in the tube), shunt lines and spurs (to remove a pod from the main tube and access the outside world), instrumentation and control system with appropriate redundancies, and a wealth of other factors that any railroad engineer would be aware of.
I'm not a railroad engineer; these are basic Industrial Management observations.
And then there's deployment…
Anyone with a passing knowledge of operations management or project management could find some possible issues with the infrastructure of Hyperloop, even without knowing the details of the technology. Not impossibilities, issues that might cost money and time.
For example, a number of logistics complications come to mind regarding the construction of the Hyperloop along Route 5, namely: the movement of large-sized tube elements; the use of the Route 5 lanes as part of the construction area (even if most of the staging is done off of the road itself) while it's in use as a public roadway; and let's not forget that California municipalities are among the most anti-change in the world: NIMBY was invented here. Unless you know someone who knows someone who knows…
To have an idea of the scale of the problem created by moving the many elements of the tube, consider what happens when just one large assembly has to move on public roadways:
Building the Hyperloop infrastructure is essentially a large-scale project management problem, and specialists would be involved; I added the example above to show that there are more obvious difficulties than the risk of depressurization; in fact, depressurization isn't much of an issue under good operations management and a well thought-out track.
But pointing out commonsensical logistical difficulties doesn't help with the whole "I am a great scientist, hear me snark" persona.
- - - - - - - - - - Footnote - - - - - - - - - -
* My current view of transportation is that trains and ships are better for freight and cars and airplanes are better for people. By cars I mean autonomous individual vehicles, not necessarily individually owned, chaining for inter-city travel at 200-300 km/h (individual pods self-organizing into convoys), and swarming for autonomous intra-city travel. Most of the current problems with air travel are economic, regulatory, cultural, and managerial, not technological, though I'd like to see supersonic aircraft further along the product development process.
Maybe the Acela corridor would make sense for Hyperloop, though. Particularly since weather in the frozen Winter wasteland and broiling Summer Inferno of the Northeast is more volatile than in California, and the Hyperloop tube would be more resilient than the air shuttles, particularly the small planes. (Boston to NYC late December in a small plane… the horror, the horror.)
But as mentioned above, I believe there are some potential high-value spillovers from the technological developments necessary for Hyperloop, including advances in materials science and production engineering, even if it isn't ever actually built.
A couple of acquaintances asked me why I don't address TF's video (or its follow-up and comments on both YouTube and Reddit) directly. Giving it minimal thought,
Second, TF's not interested in the truth: he made his second video, which is based on the Hyperloop Alpha paper, after being told by Casey Handmer that the paper doesn't reflect current thinking on Hyperloop; and,
But the main reason not to get into online arguments with strangers is basically the same as for not wrestling with a pig: you both get dirty but the pig enjoys it.