Let's say we want to check whether two variables are related: if changes in the value of one can be used to predict changes in the value of the other. There's a procedure for that:
Take the two variables, compute a metric called a correlation, check whether that correlation is above a threshold from a table. If the value is above the threshold, then say they're related, publish a paper, and have its results mangled by your institution's PR department and misrepresented by mass media. This leads to random people on social media ascribing the most nefarious of motivations to you, your team, your institution, and the international Communist conspiracy to sap and impurify all of our precious bodily fluids.
The threshold used depends on a number of things, the most visible of which is called the significance level. It's common in many human-related applications (social sciences, medicine, market research) to choose a 95% significance level.
At the 95% level, if we have 2 variables with significant correlation, the probability that that correlation is spurious, in other words that it comes from uncorrelated variables, is 5%.
(More precisely, that 95% means that if two uncorrelated variables were subjected to the computation that yields the correlation, the probability that the result would be above the threshold is 5%. But that's close enough, in the case of simple correlation, to saying that the probability of the correlation being spurious is 5%.)
The problem is when we have more variables.
If we have 3 variables, there are 3 possible pairs, so the probability of a spurious correlation is $1-0.95^3 = 0.143$.
If we have 4 variables, there are 6 possible pairs, so the probability of a spurious correlation is $1-0.95^6 = 0.265$.
If we have 5 variables, there are 10 possible pairs, so the probability of a spurious correlation is $1-0.95^{10} = 0.401$.
Let's pause for a moment and note that we just computed a 40% probability of a spurious correlation between 5 independent (non-correlated) variables. Five variables isn't exactly the giant datasets that go by the moniker "big data."
What about better significance? 99%, 99.5%? A little better, for small numbers, but even at 99.5%, all it takes is a set with 15 variables and we're back to a 40% probability of a spurious correlation. And these are not Big Data numbers, not by a long shot.

But it's okay, one would think, for there's a procedure in the statistics toolbox that has been developed specifically for avoiding over-confidence. It's called validation with a hold-out sample.
(That about 0.00% of all social science and medicine published results (though not business or market research, huzzah!) use that procedure is a minor quibble that we shall ignore. It wouldn't make a difference in large sets, anyway.)
The idea is simple: we hold some of the data out (hence the "hold-out" sample, also known as the validation sample) and compute our correlations on the remaining data (called the calibration sample). Say we find that variables $A$ and $B$ are correlated in the calibration sample. Then we take the validation sample and determine whether $A$ and $B$ are correlated there as well.
If they are, and the correlation is similar to that of the calibration sample, we're a little more confident in the result; after all, if each of these correlations is 95% significant, then the probability of both together being spurious is $0.05^2 = 0.0025$.
(Note that that "similar" has entire books written about it, but for now let's just say it has to be in the same direction, so if $A$ and $B$ have to be positively or negatively correlated in both, not positively in one and negatively in the other.)
Alas, as the number of variables increases, so does the number of possible spurious correlations. In fact it grows so fast, even very strict significance levels can lead to having, for example, ten spurious correlations.
And when you test each of those spurious correlations with a hold-out set, the probability of at least one appearing significant is not negligible. For example (explore the table to get an idea of how bad things get):

These numbers should scare us, as many results being presented as the great advantages of big data for understanding the many dimensions of the human experience are drawn from sets with thousands of variables. And as said above, almost none is ever validated with a hold-out sample.
They serve as good foundations for stories, but human brains are great machines for weaving narratives around correlations, spurious or not.
- - - - -
As an addendum, here are the expected number of spurious correlations and the probability that at least one of those correlations passes a validation test for some numbers of variables, as a function of the significance level. Just to drive the point home.
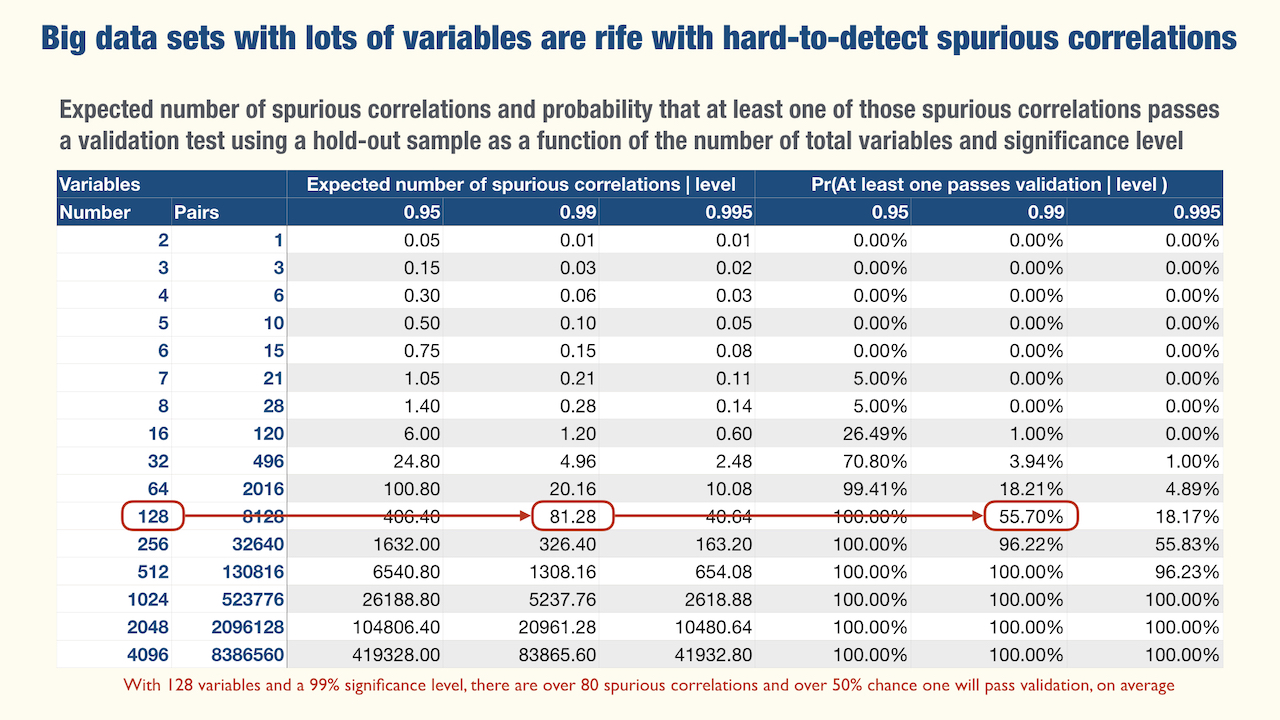
The point that Big Data without Serious Theory has a Big Problem.